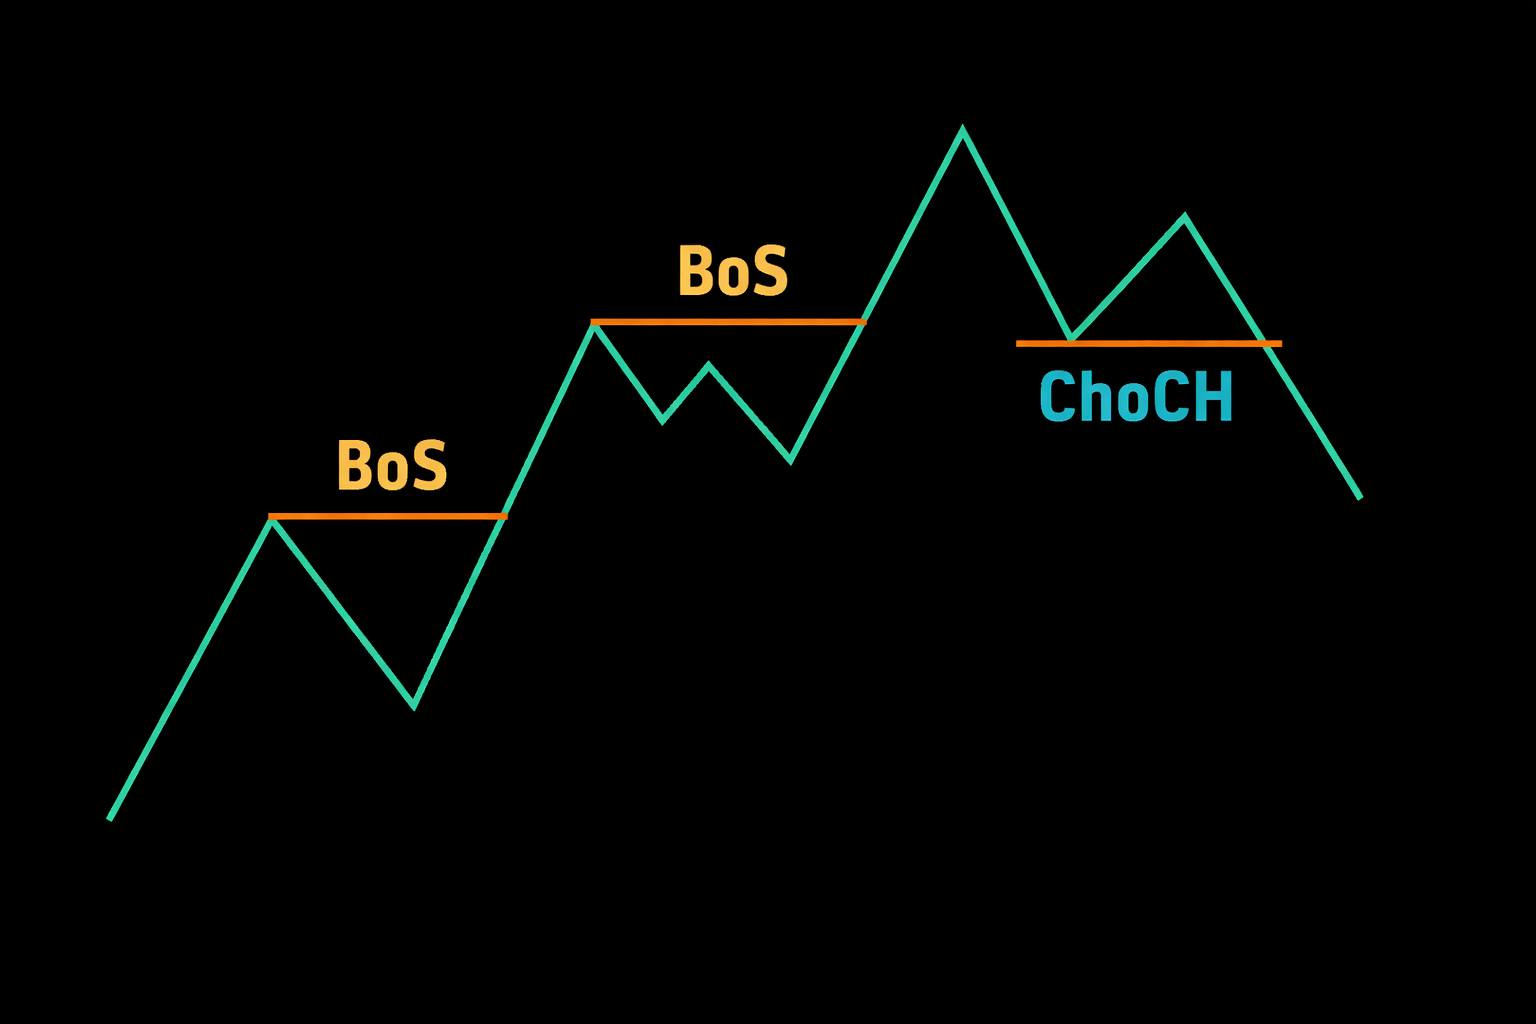
In the previous chapter, we learned that an Uptrend consists of Higher Highs and Higher Lows. But how do we know when a Higher High is genuine and when it's just a fake-out designed to trap breakout traders? How do we distinguish a legitimate trend continuation from a liquidity grab? The answer lies in understanding Break of Structure (BOS).
A BOS occurs when price trades above a previous Swing High (in an uptrend) or below a previous Swing Low (in a downtrend) and—this is critical—stays there. It is not just a wick poking above the level; it is a decisive conquest of new territory where the winning side holds their ground until the session closes. A valid BOS represents confirmation that the trend is healthy and continuing.
Think of it like a military battle. A BOS is not just touching the enemy line—it is breaking through the enemy line, establishing a new forward position, and holding that position. If you charge through and immediately retreat, you have not captured territory. You have just exposed yourself to counterattack. The same logic applies to price action.
1. The Golden Rule: Body vs. Wick
This single distinction is where 50% of retail traders get trapped and where Smart Money makes a significant portion of their profits. It seems simple, but ignoring it will cost you dearly.
The scenario: Price approaches a previous high. Breakout traders are watching. Price pokes above the high—excitement builds. They see green candles and scream "Breakout!" They buy immediately. Then, the candle closes back down below the level, leaving only a long upper wick. Suddenly, they're trapped in a losing position at the worst possible price. What looked like a breakout was actually a trap.
Valid BOS
The Candle Body CLOSES above the level.
This shows Commitment. The buyers not only pushed the price up, but they also held it there until the session closed. They established a new forward position and defended it. The sellers tried to fight back but were overwhelmed. The trend is healthy, and the break is genuine. This is your green light to look for continuation trades.
Invalid BOS (Liquidity Sweep)
Only the Wick breaks the level.
This shows Rejection. The buyers tried to push through, but sellers slapped them back down before the session closed. The level was touched but not conquered. This is NOT a continuation signal—it is often the opposite: a reversal signal indicating that Smart Money used the brief break to trigger stop losses and fill their opposing orders. This pattern is called a Stop Hunt, Sweep, or Deviation.
The lesson is simple but profound: wait for the candle to close. Never react to a wick. What happens mid-candle is noise; what happens at the close is signal.
2. Expectational Order Flow
Once you see a valid BOS, what should you expect? You should expect the trend to continue—but NOT immediately. This is where understanding market rhythm becomes crucial.
Think of the market like an athlete sprinting. No athlete can sprint indefinitely without rest.
- The Sprint (Impulse): The runner dashes forward with explosive energy and breaks through the previous record (BOS). This is the move that everyone sees—the green candles stacked on top of each other, the volume surge, the excitement.
- The Rest (Correction): The runner is now exhausted. He needs to stop, catch his breath, and drink water. He might walk backward a few steps or stand still. This doesn't mean he's given up—it means he's recovering for the next push. In market terms, this is the pullback: price retraces a portion of the impulse move.
- The Next Sprint: Once recovered, the runner explodes forward again, potentially breaking another record. In market terms, this is the next impulse leg—the continuation of the trend.
The Amateur Mistake: Amateurs buy the BOS directly. They see the breakout, get excited, and chase. They're buying the runner when he is most exhausted—at the finish line of his sprint. The market immediately begins its natural correction (the runner rests), and the amateur watches his position turn red. He panics and exits at a loss, just before the next impulse begins.
The Pro Move: Professionals see the BOS and say "Good, the trend is confirmed. The structure is bullish." But they don't chase. They wait patiently for the runner to rest—for the correction to unfold. They identify a logical pullback level (previous resistance becoming support, a key Fibonacci level, an order block) and enter there with a tight stop. This gives them a much better average entry price and significantly better risk-reward ratio.
3. BOS in a Downtrend
The logic is identical, just inverted. Everything we discussed about bullish BOS applies equally to bearish BOS with directions reversed.
- We look for price to break below the previous Swing Low—the floor that buyers were defending.
- We need a Candle Body Close below the level, not just a wick poke. A wick sweep below a low that closes back above is a potential bullish reversal signal, not a bearish continuation.
- A valid bearish BOS confirms that supply exceeds demand—sellers are in control and can push price to new lows.
- After the bearish BOS, we don't chase the breakdown. We wait for the relief rally (the formation of a Lower High) and look to sell that bounce. This gives us a better entry price with our stop above the Lower High.
The psychology is the same: the BOS is confirmation, not an entry signal. The pullback after the BOS is where you actually execute your trade.
4. Internal vs. Swing BOS (Hierarchy of Breaks)
Not all breaks are created equal. A BOS on the 1-minute chart carries far less weight than a BOS on the Daily chart. Understanding this hierarchy prevents you from overreacting to minor structural shifts while missing the major ones.
If you are trading on the 1-Hour chart, for example:
- Swing BOS (External): Breaking the major Swing High or Swing Low visible on the 4-Hour or Daily chart. This is a significant structural event. It means the higher timeframe trend has confirmed continuation. This type of BOS can fuel moves that last for days or weeks. When you see a Swing BOS, you want to be positioned aggressively in that direction.
- Internal BOS (iBOS): Breaking a smaller sub-structure high or low visible on the 15-minute or 5-minute chart. This happens frequently—sometimes multiple times per day. It is good for scalping or for timing entries within a larger setup, but don't treat it as a major event. These internal breaks are often just the market breathing—part of the natural rhythm of impulse and correction within a single leg.
The key is to match your BOS significance to your trading timeframe and style. Position traders care about Daily and Weekly BOS. Swing traders focus on 4-Hour and Daily BOS. Day traders may trade Internal BOS but always in alignment with higher timeframe structure.
Summary
A Break of Structure is your compass for trend direction. It tells you whether the bulls or bears are winning the battle. As long as the market keeps printing valid BOS in one direction—Higher Highs confirming the uptrend, Lower Lows confirming the downtrend—do not try to be a hero and trade the reversal. You might occasionally catch a counter-trend move, but statistically, trend continuation is the higher-probability play.
Remember the sequence: See the BOS, confirm the trend is intact, then wait for the pullback to enter. Never chase the BOS itself. Patience at this stage is what separates profitable traders from those who are always entering at the worst possible moment.