Imagine a football match. If I just tell you the final score was 2-1, you know who won, but you don't know how they won. Was it a dominant victory? Or did they score a lucky goal in the last second?
A Line Chart gives you the final score. A Candlestick gives you the highlights reel of the entire match. It tells you exactly how the battle unfolded between the Bulls (Buyers) and the Bears (Sellers) during that specific time period.
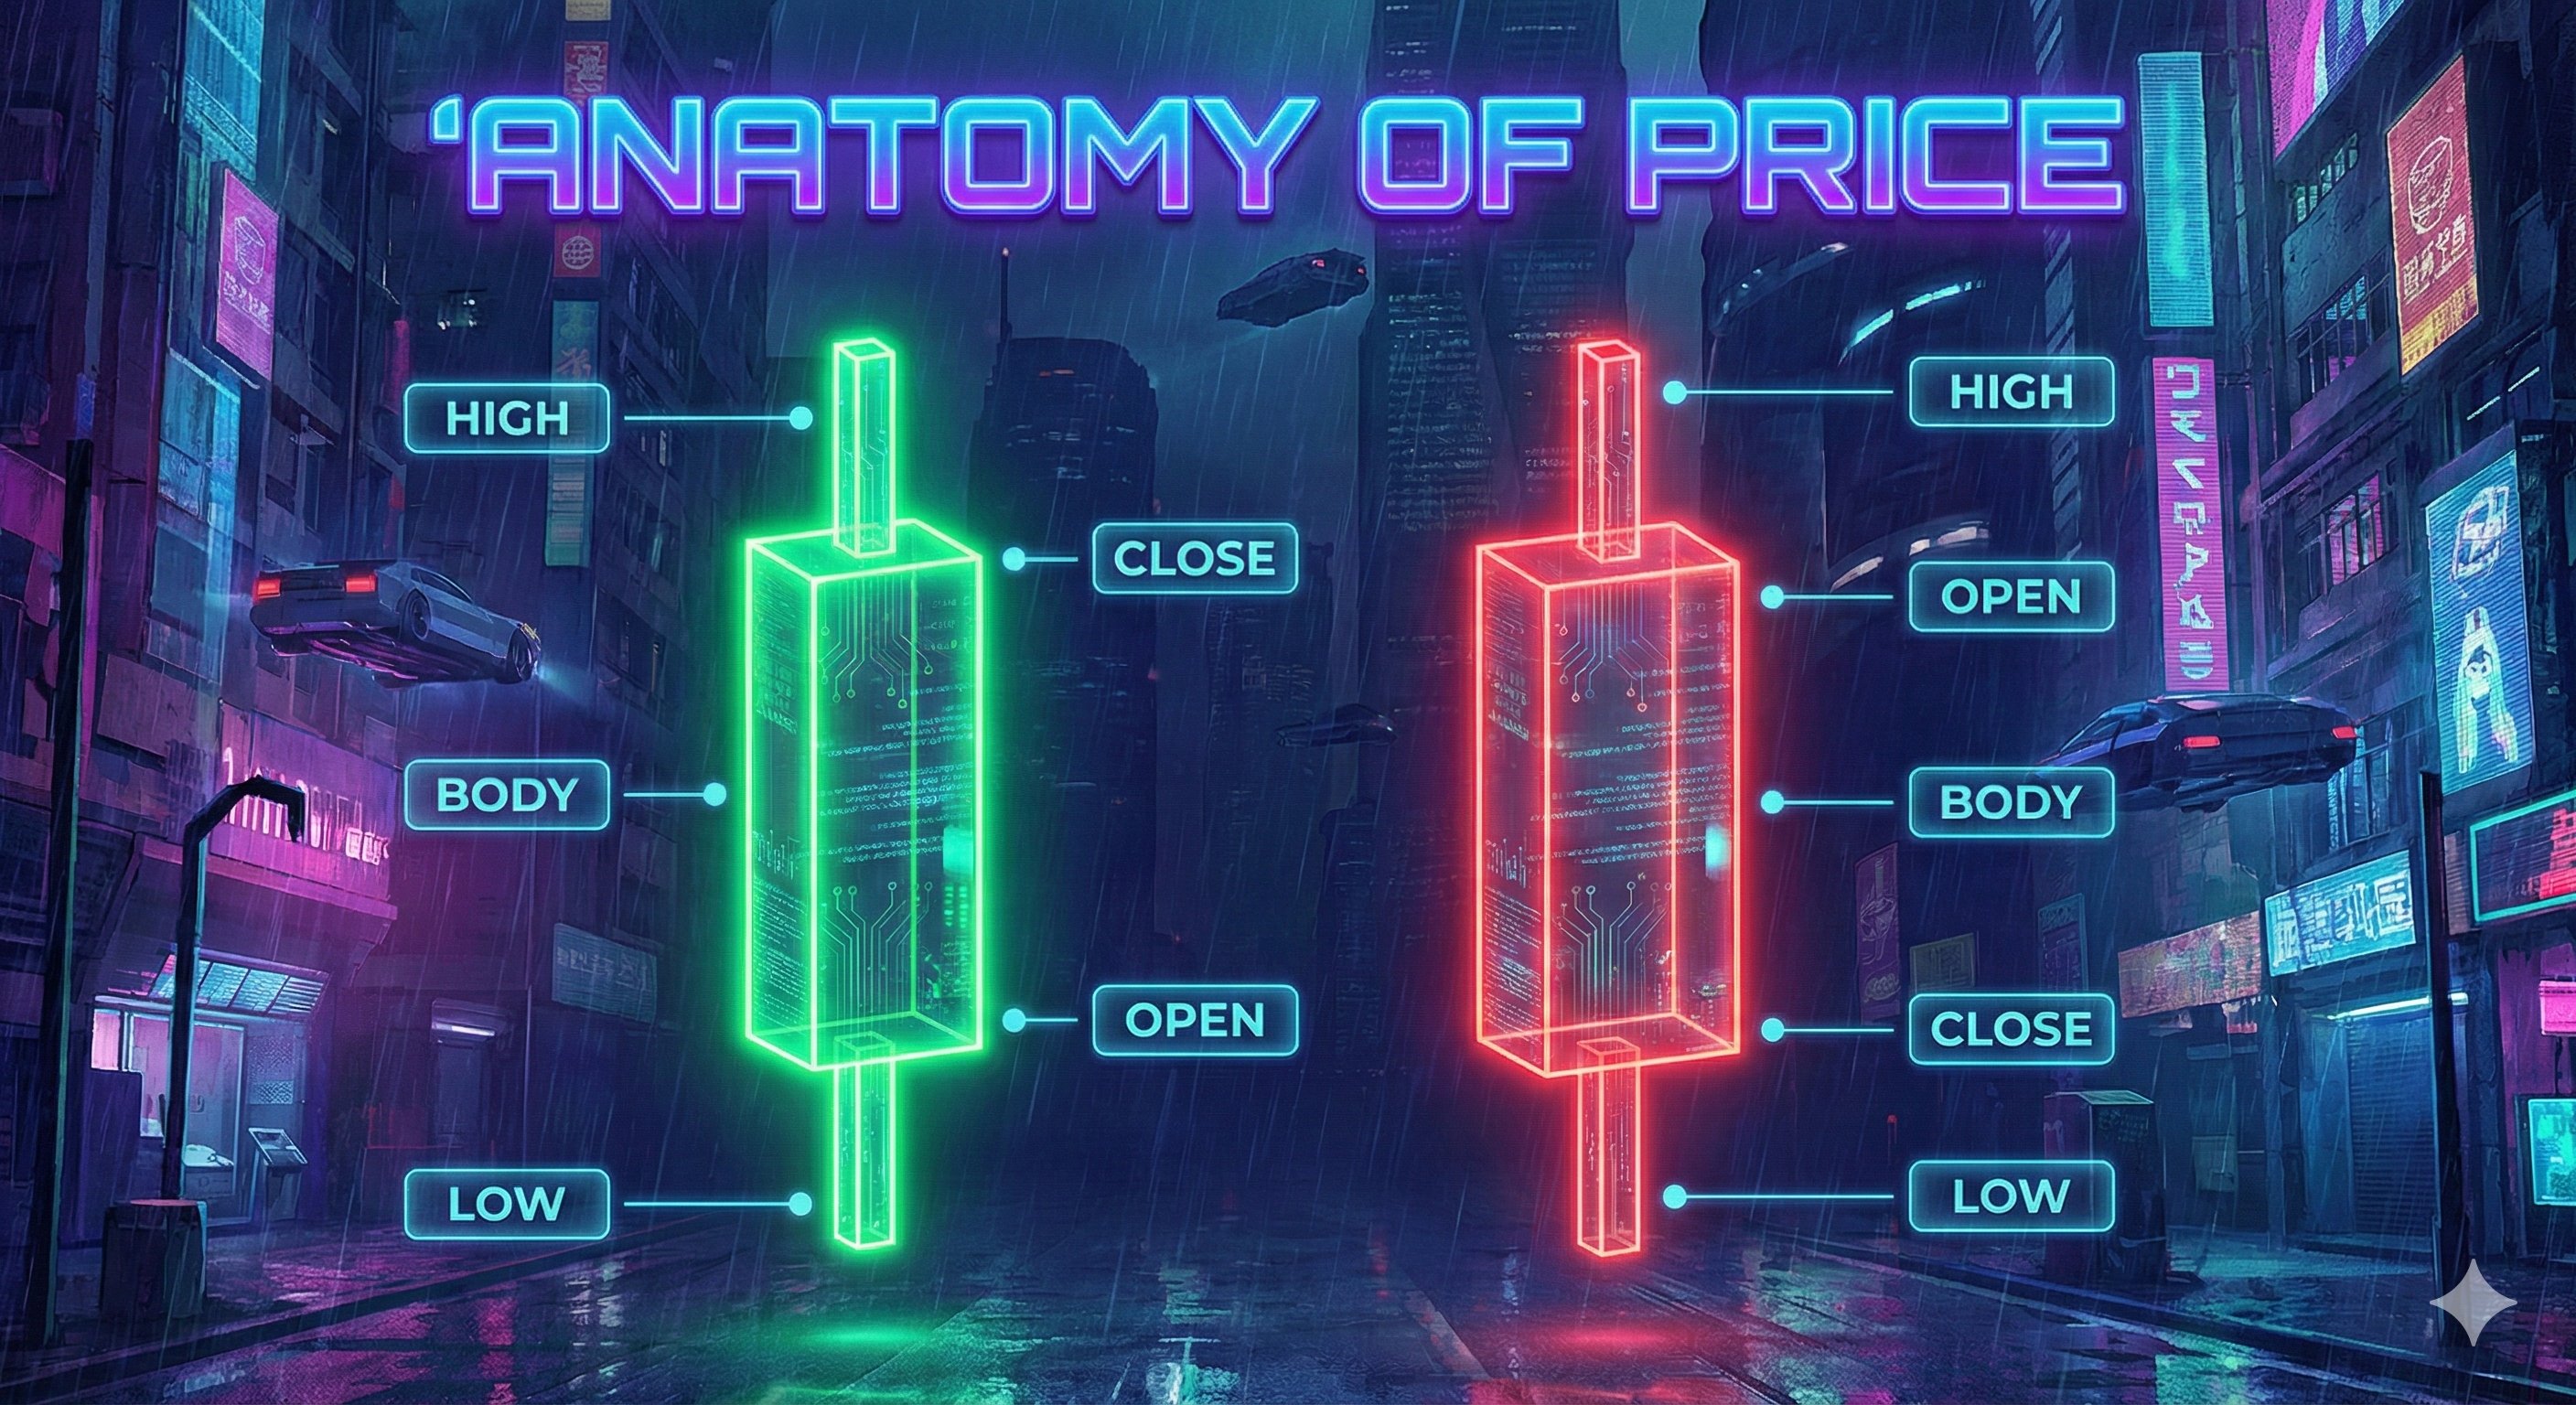
A single candle answers four critical questions:
- Open: Where did the battle start?
- High: What was the maximum territory the Bulls conquered?
- Low: What was the maximum territory the Bears conquered?
- Close: Who held the ground when the whistle blew?
1. Anatomy of a Candle
Every candle is composed of two distinct parts. Understanding the relationship between these two parts is key to reading sentiment.
-
The Real Body
The thick, colored part. It represents the distance between the Open and the Close. The Body tells you who is in control.
Big Body = Strong Conviction. Dominance.
Small Body = Indecision. Weakness. -
The Wicks (Shadows)
The thin lines sticking out above and below. They represent price levels that were reached but REJECTED.
Wicks represent failure. A long upper wick means buyers tried to push up, but sellers slapped them back down. It is a scar from the battle.
-
The Color
Green (Bullish): Close > Open. Buyers won the session.
Red (Bearish): Close < Open. Sellers won the session.
2. Reading the Story: The Psychology of Wicks
This is where amateurs see lines, but pros see human behavior. Let's analyze two specific scenarios to understand what the market is shouting at you.
Scenario A: The Long Upper Wick (The Shooting Star)
Imagine a candle opens at $10. Bulls aggressively push the price up to $15. Everyone is excited! "To the moon!"
But suddenly, massive Sell Orders hit the market at $15. The supply overwhelms demand. The price crashes back down and closes at $11.
What it means: Even though the candle might still be green (Close $11 > Open $10), the long wick tells us that the higher prices were rejected. The Bulls are exhausted. The Bears have stepped in. This is a Bearish Reversal Signal.
Scenario B: The Long Lower Wick (The Hammer)
Price opens at $10. Bears smash it down to $5. Panic selling everywhere. Stop losses are triggered.
But at $5, Smart Money steps in. They think $5 is a bargain. They buy everything. The price rallies all the way back up to close at $9.
What it means: The Bears had their chance to crash the market, and they failed. The Bulls absorbed all the selling pressure. This implies strong demand is lurking below. This is a Bullish Reversal Signal.
3. The Doji: The Sign of Indecision
Sometimes, the battle is a perfect stalemate. The Open and the Close are virtually the same price. The candle looks like a cross (+) or a thin line.
This pattern is called a Doji.
- Psychology: Neither buyers nor sellers could gain ground. The market is "taking a breath."
- Implication: A Doji often appears at the top or bottom of a trend. It signals that the momentum is dying. If you see a massive Green Candle followed by a Doji, it's a warning sign: "The Bulls are tired."
4. Momentum and Range
Don't just look at the shape; look at the Size (Range) of the candle relative to recent candles.
- Expansion Candles (Marubozu): Candles with very long bodies and tiny or no wicks. These show strong conviction—one side dominated completely. If you see consecutive expansion candles in the same direction, the trend is accelerating with momentum. This is when you want to be in the trade, riding the wave.
- Contraction Candles: Candles getting progressively smaller and smaller. This shows volatility is drying up, energy is coiling. A big move (Breakout) is usually coming soon. Think of it like a spring being compressed—eventually it releases with force.
The sequence of candle sizes tells you about momentum. Large candle → smaller candle → smaller candle suggests the move is losing steam. Small candle → small candle → LARGE candle suggests a new impulse has begun. Learn to read this rhythm and you'll anticipate moves before they fully develop.
Summary
Candlesticks are not just patterns to memorize from a cheat sheet. They are the footprints of money—the recorded history of every battle between buyers and sellers. Each candle tells a story if you know how to read it.
Don't ask "What is this pattern called?" Ask "Who is winning the war right now? Who has momentum? Who is exhausted? Who just got rejected?" If you can answer these questions by looking at raw candles—without any indicators—you are ahead of 90% of retail traders who are busy looking at lagging mathematical formulas instead of the actual price action in front of them.
Master the candle, and you master the foundation of all technical analysis.