If you stripped away every indicator, every news feed, every analyst opinion, and every economic report, what would remain? Only Price and Time. Market Structure is simply the study of how Price moves over Time—the raw, unfiltered language of the market itself.
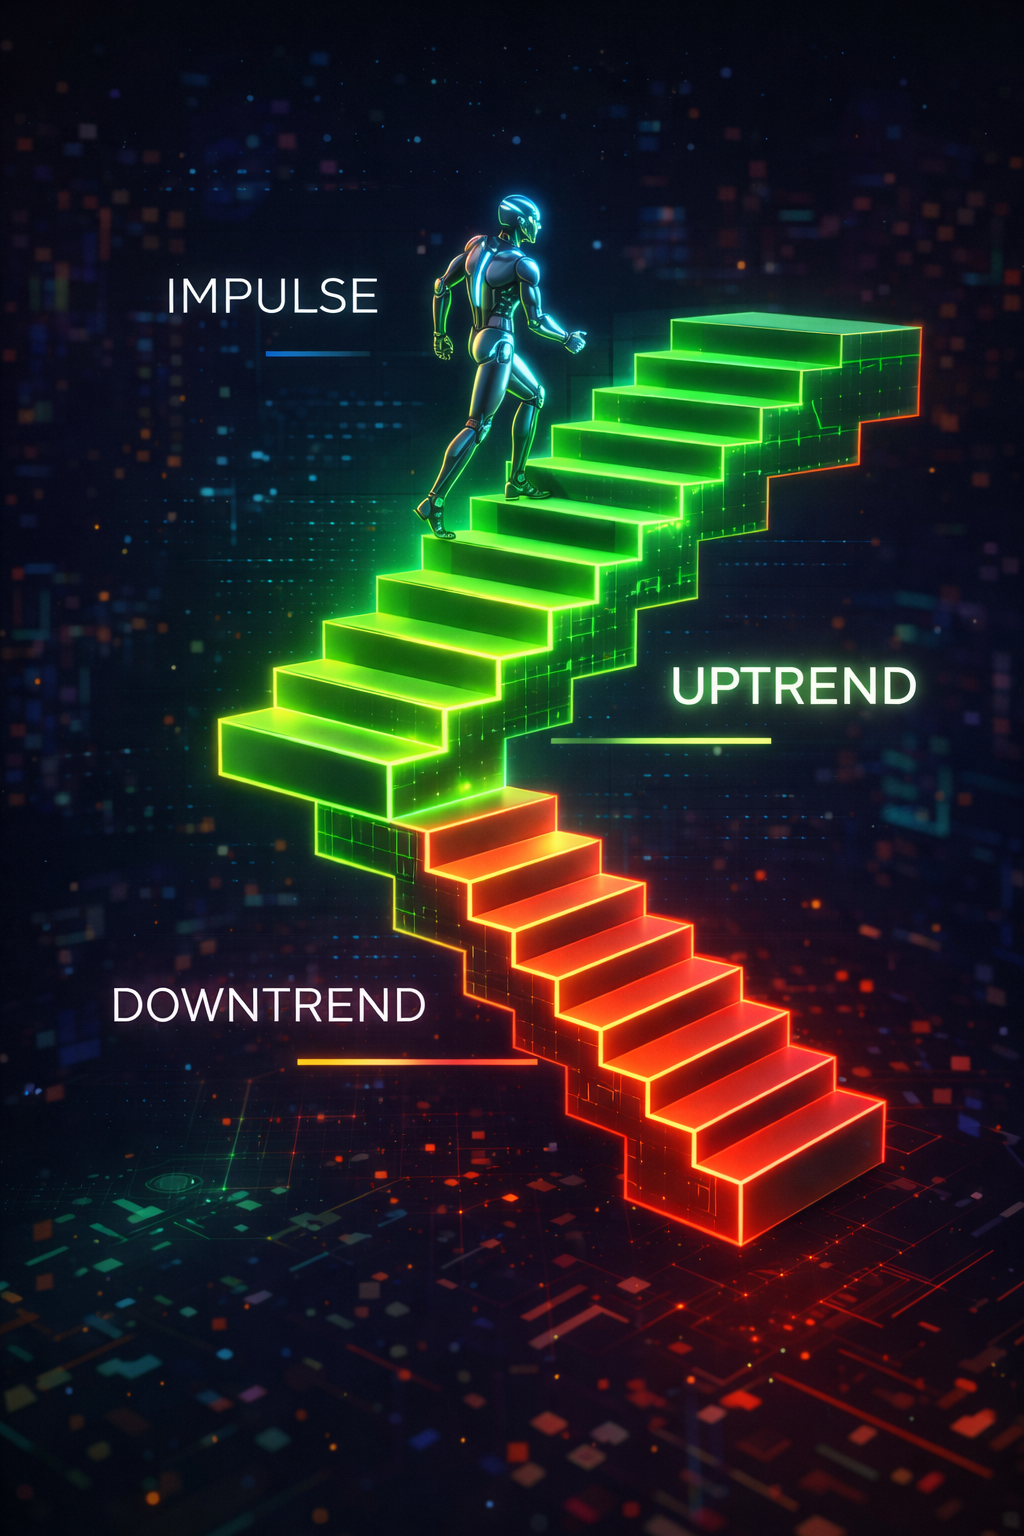
The market does not move in a straight line. Even the strongest trends are not straight diagonal lines from bottom left to top right. Instead, the market moves in waves. It inhales (Impulse) and exhales (Correction). It runs and rests. It attacks and retreats. By mapping these rhythmic waves, we can answer the two most critical questions in trading:
- Bias: Which direction should I be trading? (Long or Short) This determines whether you should be looking for buying opportunities or selling opportunities.
- Invalidation: At what exact price point is my idea proven wrong? This gives you a logical, objective Stop Loss level—not a random number based on how much you can afford to lose.
Market Structure is the only non-lagging "indicator" in existence because it is not an indicator at all—it is the actual price action itself. While RSI calculates what happened in the past and Moving Averages smooth historical data, Market Structure shows you what is happening right now, in real time.
1. The Building Blocks: Swings
Structure is built from Swing Points. These are the U-turns in the market—the moments where momentum shifts from one direction to another. Think of them as the pivots around which the entire market rotates.
Swing High (The Peak)
A point where price stopped going up and started going down. It represents a zone where Sellers overpowered Buyers—where supply exceeded demand. Every Swing High marks a potential Ceiling (Resistance) that the market may respect again in the future. The higher the timeframe, the more significant the Swing High.
Swing Low (The Valley)
A point where price stopped going down and started going up. It represents a zone where Buyers overpowered Sellers—where demand exceeded supply. Every Swing Low marks a potential Floor (Support) that the market may defend again in the future. These are the levels where Smart Money stepped in.
The key to identifying valid Swing Points is to look for obvious turns. If you have to squint, zoom in excessively, or debate whether something is a Swing Point, it probably isn't significant enough to matter. The best Swing Points are visible on a zoomed-out chart—the kind that make you say "that's clearly a peak" or "that's clearly a bottom."
Note: You don't need a "Zig Zag" indicator to find these. Your eyes are the best tool. Indicators often create false Swing Points in choppy markets or miss important ones during explosive moves. Trust your visual pattern recognition—it evolved over millions of years for exactly this kind of task.
2. Impulse vs. Correction
This is the heartbeat of the market. Understanding the difference between these two types of moves is absolutely critical for timing your entries and avoiding the most common trading mistakes.
The Impulse (Expansion)
This is the strong, fast, aggressive move in the direction of the trend. The candles are often large, same-colored, and stacked with minimal wicks. Volume tends to be higher than average. These moves happen when one side of the market has overwhelming control—buyers are aggressive and willing to pay any price to get in, or sellers are panicking and dumping at any price to get out. This is where the money is made. Impulse moves can cover in hours or days what the market spent weeks building up to.
The Correction (Pullback)
This is the slow, choppy, messy move against the trend. It represents profit-taking by the winners and counter-trend attempts by traders who think "it's gone too far." The candles are typically smaller, more mixed in color, with longer wicks—signs of indecision and battle. This is where amateurs get trapped ("It's reversing! I should sell!") or bored ("It's doing nothing, I'm getting out"). They exit their winning positions precisely when they should be holding. We wait for the Correction to finish before entering.
The key insight: Corrections are necessary. They allow overbought or oversold conditions to reset. They shake out weak hands. They provide the fuel (liquidity) for the next impulse. Without corrections, trends would exhaust themselves too quickly.
3. External vs. Internal Structure
This is an advanced concept that separates consistently profitable traders from those who struggle despite having good knowledge. It solves the dreaded "Fractal Chaos" problem—where every timeframe seems to tell a different story.
External Structure refers to the major Swing Points on your higher timeframe—the "big picture" trend that governs all activity. Internal Structure refers to the sub-structure happening within a single leg of that external move—the smaller waves within the larger wave.
The Fractal Trap Example
You are looking at a Daily Uptrend (External Structure). The Daily chart shows clear Higher Highs and Higher Lows. Everything looks bullish.
Suddenly, on the 1-Hour chart, the price starts making Lower Highs and Lower Lows. The 1-Hour structure looks bearish. You now have conflicting information. What do you do?
The Amateur: "The trend reversed! The 1-Hour is bearish! Sell!" He enters short. Price drops a bit more, then violently reverses and rallies. He gets stopped out for a loss. Confused and frustrated, he watches as price continues making new Daily highs without him.
The Pro: "This 1-Hour downtrend is just a Correction (Internal Structure) within the Daily Uptrend. It looks scary, but it's just the market breathing. I will wait for this Internal Downtrend to reach a Daily Support level—a key area where the External Structure suggests buyers will return—and then I will look for Long entries."
Takeaway: Always respect the External Structure (Higher Timeframe) over the Internal Structure. The Big Trend eats the Small Trend. A Lower Timeframe reversal inside a Higher Timeframe trend is usually just a pullback, not a true reversal. Only when the Higher Timeframe structure breaks should you change your directional bias.
4. Defining Invalidation (Where You Are Wrong)
One of the greatest gifts that Market Structure analysis provides is a logical, objective place for your Stop Loss. No more guessing. No more using arbitrary pip counts or dollar amounts. The market itself tells you where your idea is invalid.
- In an Uptrend, your bullish idea is valid as long as the price stays above the Last Higher Low. This is your line in the sand—the fortress that bulls are defending.
- If price breaks below that Higher Low with a clear candle body close, the structure is broken. The Uptrend is over or at minimum pausing. Your bullish thesis has been invalidated by the market itself.
- In a Downtrend, the logic is inverted. Your bearish idea is valid as long as price stays below the Last Lower High. If price breaks above it, your short thesis is invalid.
This removes emotion from the equation. You aren't hoping the trade works; you aren't praying to the market gods. You are simply executing a plan with clearly defined rules. If the level breaks, you exit immediately. No questions asked. No second-guessing. No moving your stop "just a little further" because you feel the trade is right. The market has spoken. You listen.
This discipline is what separates professionals from gamblers. Professionals accept small losses gracefully when structure breaks. Gamblers hold onto losing positions, hoping for a miracle, until small losses become account-destroying disasters.
Summary
Market Structure is not about predicting the next candle. It is about identifying the Path of Least Resistance—the direction in which price flows most easily. If the river flows South, don't try to swim North. If the structure is bullish, don't fight it with short positions. Find the structure, identify the trend, wait patiently for the pullback, and then flow with the current.
The beauty of structure-based trading is its objectivity. Two traders looking at the same chart will generally agree on where the Swing Highs and Lows are, what the trend is, and where invalidation lies. This shared understanding creates the self-fulfilling prophecies that make these levels work.