Before candlesticks, before indicators, and before computers, there was Charles Dow. He founded the Wall Street Journal and created the Dow Jones Industrial Average in the 1880s. He didn't write a formal book—his insights were published as a series of editorials in his newspaper. After his death, his colleagues compiled these writings into what we now call Dow Theory.
Many traders skip this chapter. They think it's "outdated." After all, what can a guy from the 1800s teach us about trading in the age of algorithms and artificial intelligence? The answer: Everything. Smart Money Concepts (SMC), Price Action methodology, Elliot Wave Theory, and even modern quantitative strategies are all derivatives of Dow's original observations. If you understand Dow, you understand the DNA of the market itself.
Dow Theory is not about predicting the future with a crystal ball. It is about categorizing the Present. It provides a framework for answering the most expensive question in finance: "Are we in a Bull Market or a Bear Market?" Get this question right, and you can make money with mediocre entries. Get it wrong, and the best entry in the world cannot save you from the tsunami moving against you.
The principles Dow identified—trend phases, confirmation signals, and the psychology of market participants—are as relevant today as they were 140 years ago. Human nature does not change. Greed and fear drive markets today exactly as they did when traders communicated by telegram instead of fiber optic cables. The speed has changed, but the game remains identical.
1. The Market Has Three Movements
Dow realized that price is not random chaos. It moves like the ocean, with predictable patterns at different scales.
- Primary Trend (The Tide): This is the major trend lasting months to years. It is the unstoppable force—the direction in which the entire market is moving. You never trade against the tide. A primary Bull Market can last 2-4 years; a primary Bear Market typically runs shorter but more violently. This is what Warren Buffett is trading when he says he's a "long-term investor."
- Secondary Trend (The Waves): These are corrections within the primary trend, lasting weeks to a few months. They typically retrace 33% to 66% of the previous primary move. They are psychologically deceptive because they look like reversals to untrained eyes. This is where most traders get shaken out—they sell during a correction, convinced the Bull Market is over, only to watch helplessly as prices resume their climb without them.
- Minor Trend (The Ripples): Daily and intraday fluctuations lasting hours to a few weeks. Dow considered this "noise" and largely ignored it for serious investment decisions. Ironically, this is exactly where modern Day Traders spend most of their time and money. They are trading the ripples while getting dragged out to sea by the tide.
The implication is profound: before you place any trade, you must know which "layer" of the ocean you are dealing with. Are you trying to catch the tide (position trading), ride a wave (swing trading), or surf ripples (day trading)? Your strategy, timeframe, and risk management must match your chosen layer.
2. The Three Phases of a Trend
This is the most actionable part of the theory. Markets evolve through specific psychological phases. Knowing where you are in the cycle prevents you from being the "greater fool" who buys at the top.
Phase 1: Accumulation (The Stealth Phase)
The market has crashed. The news is terrible. Newspapers declare "Crypto is dead" or "The stock market will never recover." The public is selling in panic, desperate to exit at any price. Sentiment indicators are at extreme pessimism.
But something strange happens: the price stops dropping. Why? Because Smart Money—institutional investors, hedge funds, and informed insiders—is quietly absorbing the panic selling. They are buying millions of shares or coins without moving the price significantly. The chart looks flat, boring, and dead. Volume is low. This is the hardest time to buy psychologically because everything screams "danger," but it is the most profitable entry point of the entire cycle. When you buy during Accumulation, you are buying from emotional sellers at discount prices.
Phase 2: Public Participation (The Markup)
The price breaks out of its boring range. The trend becomes visible on the charts. Technical analysts spot the Higher Highs and Higher Lows. The news turns cautiously positive. "Maybe the bottom is in."
Trend followers jump in. Momentum funds deploy capital. Prices move fast and aggressively because Smart Money has already accumulated—there is very little supply left to absorb. This is where we want to trade. The trend is clear, the momentum is strong, and you have the wind at your back. You are riding the wave that Smart Money created. This phase can last months or even years in major Bull Markets.
Phase 3: Distribution (The Trap)
The trend is now front-page news. Your taxi driver gives you stock tips. Your grandmother asks how to buy Bitcoin. Social media influencers declare "it can only go higher." The news is euphoric—magazines publish covers asking "Is the Dow going to 100,000?"
This is the danger zone. While the public is buying with maximum enthusiasm, Smart Money is quietly selling their positions to these eager late-arrivals. Volume remains high, but the price stops advancing—it churns sideways in a volatile range. The structure becomes messy and confusing. Eventually, when Smart Money has finished distributing, supply overwhelms demand, and the crash begins. The same public that bought the top will panic sell at the bottom, completing the cycle and setting up the next Accumulation phase.
3. The Trend Persists Until Definitively Reversed
Dow's most famous rule is essentially Newton's First Law of Motion applied to finance: "A trend in motion is assumed to be in effect until it gives a definite signal that it has reversed."
This sounds simple, but it is one of the most profound concepts in trading. It means:
- Do not try to pick the top. The market can stay irrational far longer than you can stay solvent.
- Do not try to catch a falling knife. A stock going from $100 to $50 can still go to $10.
- Do not bet against the trend just because "it's gone too high" or "it's oversold." These are subjective opinions, not structural facts.
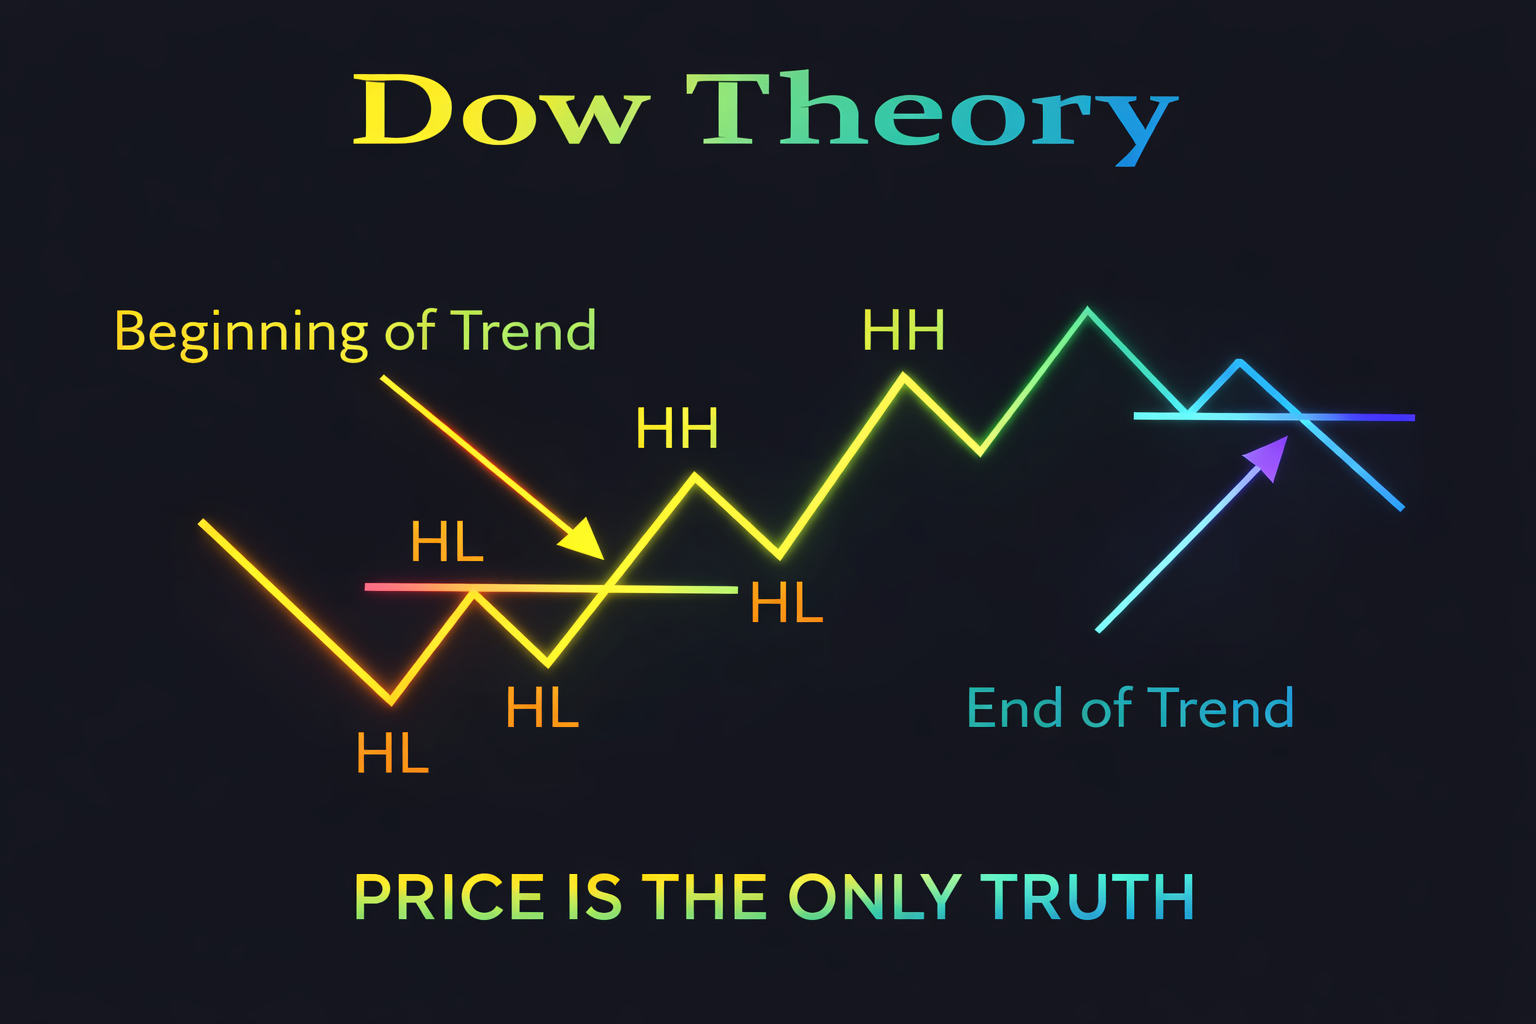
You must wait for the Structure to break before changing your bias. If an Uptrend is making Higher Highs and Higher Lows, it is an Uptrend. Period. Until it makes a Lower Low—breaking the sacred floor of the trend—you have no structural evidence to sell. The trend is innocent until proven guilty by price action, not by your feelings or by some oscillator telling you it's "overbought."
This principle alone could save most traders from their biggest losses. They get destroyed trying to short strong Bull Markets or buy crashing Bear Markets, convinced they're smarter than the collective market. They fight the tide and drown.
4. Volume Must Confirm the Trend
Dow believed volume was secondary to price, but vital for confirmation. Volume represents the fuel behind the move—it tells you whether conviction is real or fake.
- In a healthy Uptrend, volume should increase on the rallies (strong buying pressure) and decrease on the pullbacks (weak profit taking). This pattern shows that buyers are aggressive and sellers are passive.
- If price makes a new High but volume is significantly lower than the previous High, it is a divergence. It warns that the fuel is running out. It's like a car coasting uphill without gas—momentum will carry it a bit further, but gravity will soon take over.
- Similarly, in a healthy Downtrend, volume should increase on the drops and decrease on the relief rallies.
Volume divergence is an early warning system. It doesn't guarantee a reversal, but it tells you to tighten your stops and pay closer attention. The trend is getting tired.
5. Indices Must Confirm Each Other
Dow originally applied this to the Industrial Average and the Railroad (now Transportation) Average. His logic was simple: if factories are producing goods (Industrial), those goods must be shipped (Transportation). If Industrial stocks make new highs but Transportation stocks don't follow, something is wrong. The economy is sending mixed signals.
Today, we apply this principle more broadly. If the S&P 500 makes new highs but the Russell 2000 (small caps) lags badly, it suggests the rally is narrow and weak. If Bitcoin rallies but Ethereum doesn't follow, it raises questions about the strength of the crypto Bull Market. Confirmation across related assets increases the reliability of the signal.
6. The Market Discounts Everything
This is Dow's most philosophical tenet. The market already knows everything—earnings, geopolitical events, natural disasters, new regulations—before you do. All known information is already reflected in the current price.
This is why technical analysis works: we don't need to know the "why" behind a move. We don't need to read earnings reports or predict elections. We simply read the price action. If price is making Higher Highs, someone with better information than us is buying. We follow the footprints of Smart Money instead of trying to outsmart them.
Summary
Dow Theory teaches us humility. We are not here to outsmart the market or predict the future. We are here to observe the present, identify which phase we are in, align ourselves with Smart Money, and ride the trend until the structure definitively breaks.
These six tenets form the philosophical foundation upon which all modern technical analysis is built. Every concept you will learn—from candlestick patterns to Smart Money Concepts—traces its roots back to Charles Dow's observations about market psychology and structure.
Now that we understand the philosophy, let's get practical. How exactly do we define a trend on a chart? How do we identify those Higher Highs and Higher Lows with precision? Let's map out the mechanics of Market Structure.