If you take only one tool from this entire course, let it be this one. Volume Profile (VPVR) connects directly to Auction Market Theory.
The Supermarket Analogy
Imagine apples usually sell for $2.00. Huge volume happens here (Acceptance). If the price drops to $1.00, everyone buys (Volume Spike). If the price jumps to $10.00, nobody buys (Volume Gap). Volume Profile visualizes exactly where the market found "Fair Value" and where it rejected "Unfair Value."
1. Anatomy of the Profile
To trade with the institutions, you must speak their language. Here are the four critical components of a profile:
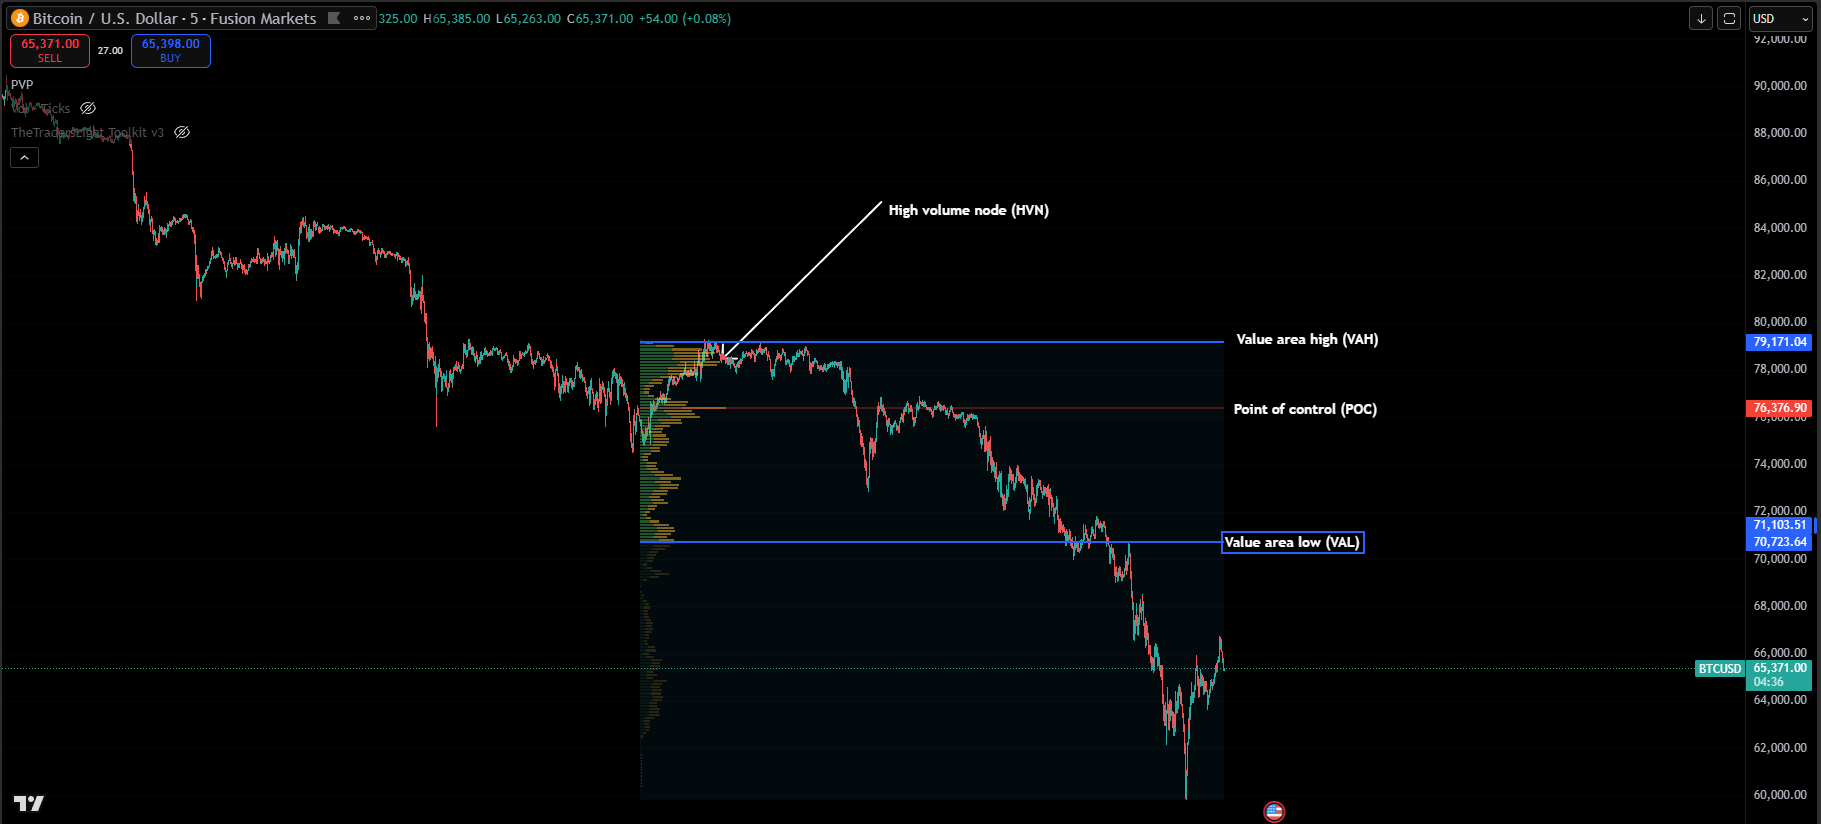
POC (Point of Control)
The single price level with the Highest Volume. This is the "Fair Value." Price treats this line like a magnet. It loves to return here.
VA (Value Area)
The range containing 70% of the total volume.
VAH (Value Area High): Resistance.
VAL (Value Area Low): Support.
HVN vs. LVN (Mud vs. Air)
- High Volume Nodes (HVN): Fat bulges in the profile. These are areas of heavy acceptance. Price moves slowly through these zones, grinding and chopping. It's like walking through mud.
- Low Volume Nodes (LVN): Thin gaps in the profile. These are areas of rejection or rapid movement. Price moves fast through these zones because there is no liquidity to stop it. It's like falling through air.
2. Profile Shapes & Psychology
The shape of the profile tells you the story of the day. Is the market balanced? Or is one side panicking?
The "D-Shape" (Balance)
Looks like a Bell Curve. Buyers and Sellers are equal. Strategy: Mean Reversion. Buy the Low (VAL), Sell the High (VAH). Do not look for breakouts.
The "P-Shape" (Short Covering)
Fat top, thin bottom. Price rallied and found acceptance at higher prices. Bears are trapped below. Strategy: Buy the pullback to the bottom of the 'P'.
The "b-Shape" (Long Liquidation)
Fat bottom, thin top. Price dropped and found acceptance lower. Bulls are exiting. Strategy: Sell the rally to the top of the 'b'.
3. The "Naked POC" Strategy
This is a sniper strategy with a high win rate.
A Naked POC (nPOC) is a Point of Control from a previous session that has not yet been touched by price. Because the POC represents a massive cluster of historical orders, the market has a "memory" of this level.
4. Fixed Range Volume Profile (FRVP)
Standard Volume Profile shows the whole screen. But the Fixed Range tool allows you to be a detective. You can drag it over a specific price leg to see exactly where the support is.
How to use it:
- Identify a strong Impulse Move (Trend).
- Draw the FRVP from the Low to the High of that impulse.
- Identify the POC of that specific leg.
- That is your Buy Level. When price pulls back to that POC, it is testing the "Heart" of the trend.
Summary
Price seeks Value. If price is far away from the POC, it is "Unfair." It will try to revert to the mean (POC). If price breaks out of a Value Area and builds volume there, it is "Acceptance," and the trend continues.
Stop drawing random support lines. Draw levels where the Volume is.