Imagine a Whale—a major bank, hedge fund, or institutional investor—wants to buy $100 Million worth of Bitcoin. They cannot just open Coinbase, type "$100,000,000" in the buy field, and click "Market Order." If they did, the price would skyrocket instantly from their own buying pressure. They might click "Buy" at $50,000 but end up with an average fill price of $55,000 or higher because their single order consumed all available sell orders at every price level. This is called Slippage, and it would cost them millions in poor execution.
To buy $100M efficiently—without moving the price too much and alerting everyone to their intentions—they need someone to Sell $100M to them at a specific price level. They need a concentrated pool of sell orders waiting in one place.
Where can they find $100M of sell orders sitting conveniently in one location? At your Stop Loss. And at the stop losses of thousands of other retail traders who all learned the same "put your stop below support" lesson from the same trading books and courses. This is why price hunts your stops. It's not personal—the institutions don't know you exist. It's just business. It's pure mechanics. The market needs to facilitate large orders, and your stop losses are the most convenient source of concentrated liquidity.
1. What is Liquidity?
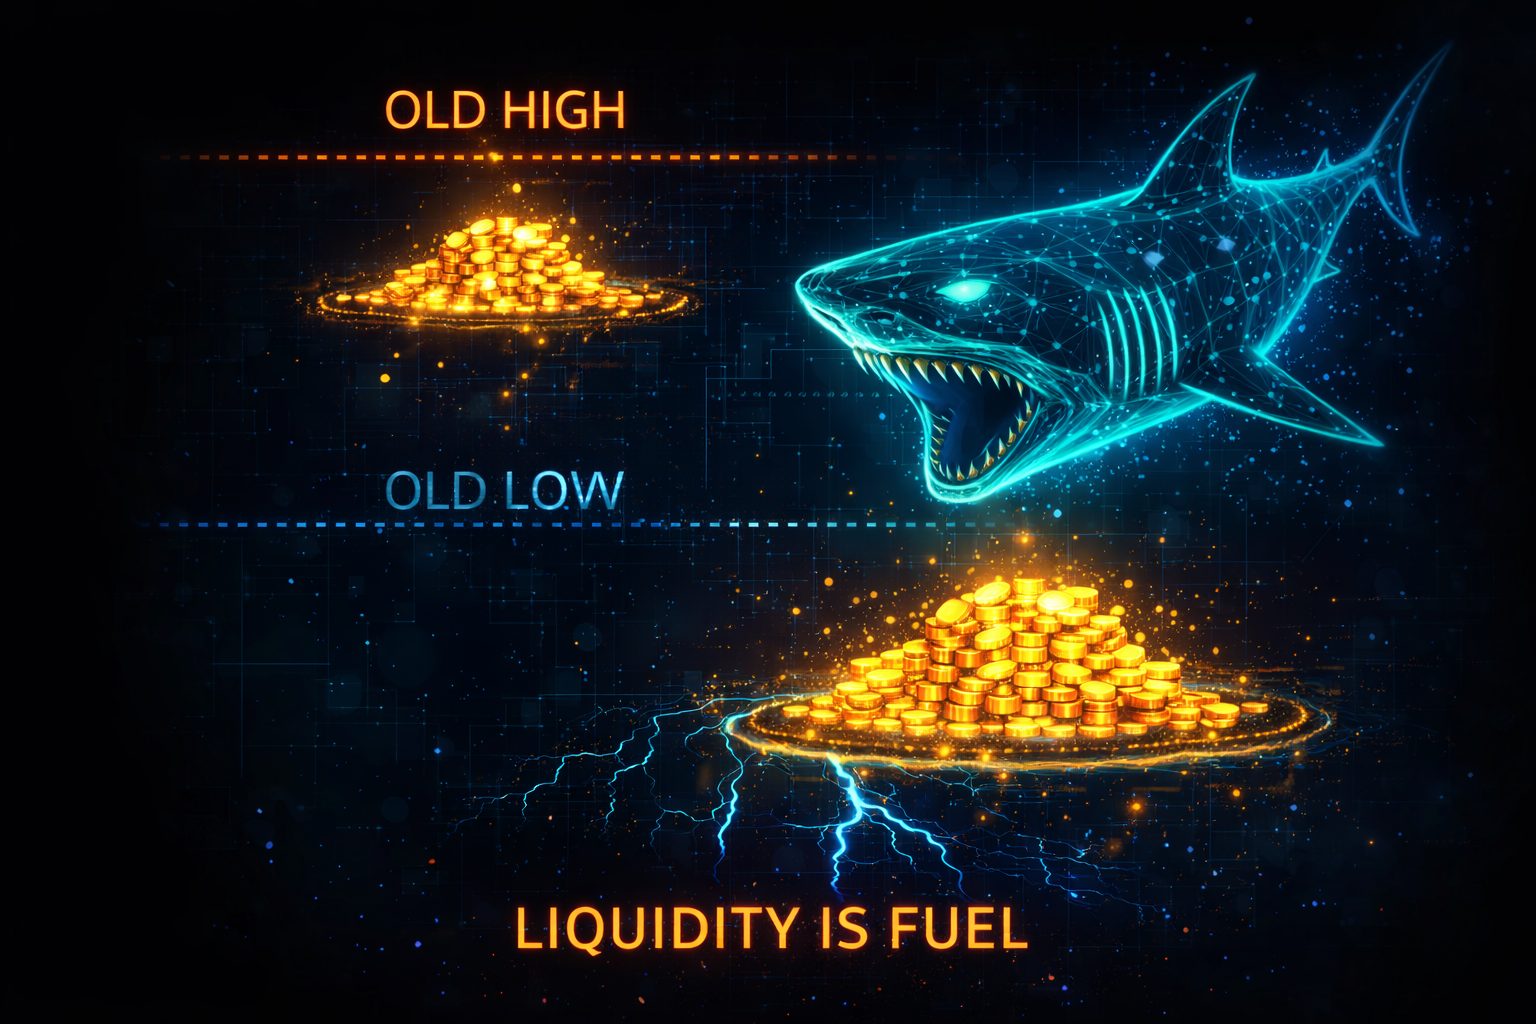
In simple terms, Liquidity = Pending Orders. It represents the fuel that makes price move—the resting orders waiting to be triggered and executed.
Liquidity is not evenly distributed across the chart. It clusters in specific, predictable areas where a large number of traders have placed their Stop Losses or pending orders based on standard technical analysis teachings. These clusters become magnets for price because they represent the easiest path for institutions to fill their large orders.
- Buy Side Liquidity (BSL): Resting above Highs. When traders are Short, they place their Stop Losses above recent highs ("If price goes above this high, my short thesis is wrong"). A stop loss on a Short position is a Buy Order. So above every significant high, there's a pool of Buy orders waiting to be triggered. Institutions who want to sell use this liquidity to fill their Sell orders at premium prices.
- Sell Side Liquidity (SSL): Resting below Lows. When traders are Long, they place their Stop Losses below recent lows ("If price goes below this low, my long thesis is wrong"). A stop loss on a Long position is a Sell Order. So below every significant low, there's a pool of Sell orders waiting to be triggered. Institutions who want to buy use this liquidity to fill their Buy orders at discount prices.
The market's delivery algorithm—whether you conceptualize it as actual code or simply the emergent behavior of large players—naturally seeks these areas of concentrated liquidity to facilitate the execution of large institutional orders. Price is drawn to liquidity like water flows to the lowest point.
2. The "Stop Hunt" Mechanism
Let's walk through a classic scenario that plays out thousands of times per day across all markets. Understanding this mechanism will change how you view every chart.
- The Setup: Retail traders see a "Double Top" pattern forming—price hit the same resistance level twice. Every trading book says this is a bearish reversal pattern. They Sell, expecting price to drop.
- The Obvious Stop: Following standard risk management, they place their Stop Losses just above the highs. "If price breaks above those highs, the pattern is invalid, so I'll exit." This is textbook trading—and it's exactly what institutions count on.
- The Institutional Need: Smart Money also wants to Short the market—they have bearish analysis too. But they need to sell millions of dollars worth. They need a massive pool of Buy orders to sell into. Where are those Buy orders? Resting above the highs as retail stop losses.
- The Hunt: Smart Money (or the natural market mechanics) pushes the price UP, breaking above the double top highs. It looks like a "bullish breakout" to untrained eyes.
- The Trigger: Retail Stops are triggered en masse. A Stop Loss on a Short position executes as a Market Buy Order. Thousands of traders simultaneously send Buy orders into the market.
- The Fill: This flood of Buy Orders provides the liquidity Smart Money needs. They sell their massive positions into this wave of desperate buying. They get excellent fill prices at the top.
- The Reversal: Once Smart Money is filled, there are no more buyers left—they all just got stopped out. The price has nowhere to go but down. It crashes. Retail traders are left crying "The market is rigged! They hunted my stops!"
The market isn't rigged against you personally. It's simply designed to facilitate large orders, and your predictable stop loss placement makes you the liquidity source.
3. High Probability Targets
Where is the juiciest liquidity?
Equal Highs / Lows (EQH/EQL)
The classic "Double Top" or "Double Bottom." Retail books teach this as a strong reversal pattern. Smart Money sees it as a buffet of stops. Price almost ALWAYS breaks these levels eventually.
Trendline Liquidity
Retail traders love diagonal trendlines. They put their stops just below the line. When price breaks the trendline, it triggers a cascade of stops, accelerating the move.
4. Liquidity is Not a Signal (Critical Distinction)
This is where many traders who learn about liquidity go wrong. They see liquidity above a high and think: "Price MUST go there, so I'll just wait and short it." Then price goes there... and keeps going. They get destroyed.
Just because there is liquidity above a high doesn't mean price must go there right now. Liquidity tells you where price is likely to go eventually, but it doesn't tell you when or what happens after.
Think of it this way: Liquidity is a Magnet—it attracts price. But Market Structure is the Compass—it tells you which direction the market is actually trending. A magnet can pull a car, but if the car is driving 100mph in the opposite direction, the magnet's pull is irrelevant until the car slows down.
Use Liquidity primarily to determine your Targets (Take Profit levels), not your Entries. If you're long in an uptrend, look for liquidity above (equal highs, previous highs) as your profit target. We exit where retail enters. We take profits at the levels where breakout traders are buying with excitement.
Summary
Stop looking at charts as "Patterns" to memorize from a cheat sheet. Start looking at them as maps of where the money is hiding. Before every trade, ask yourself two questions: "If I was a typical retail trader, where would my stop loss be?" and "Where are the obvious levels where stops are clustered?" Those are the areas price is magnetically drawn toward.
Once you internalize this perspective, you stop being the hunted and start hunting alongside the hunters. You stop placing your stops at obvious levels. You start anticipating where price needs to go to collect liquidity—and you position yourself to profit from that journey rather than being the victim of it.